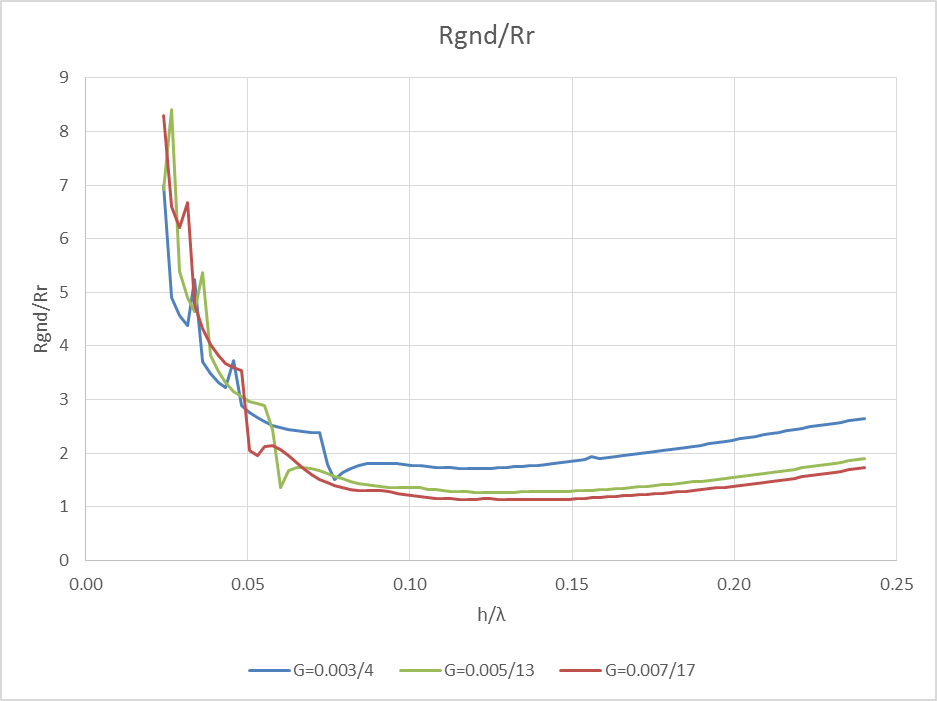
Ratio of Ground-Loss Resistance to Radiation Resistance versus Height Above Ground of STL Antennas
Showing a curve for each of three types of ground.
A PNG image file from the blog of Owen Duffy, VK1OD
Obtain mathematical curves from mere images of graphs: photos, xerox copies, etc.
Get output as either a spreadsheet or spline curve.
I found myself in a math-related predicament from which there seemed no easy way out. I was needing to author a suite of curve-fitting functions. And the curves I was wanting to fit were available to me only as an image file of the original graph. The very same one as shown below.
|
|
The author of the document containing this graph remarked as how curves were revealed beneath all the obvious noise. In order to make a function therefrom, that noise must first go away. Also I was needing to expand the graph, extending it to both left and right. Not far to the left; but quite a long ways to the right. In the rightward direction, it would need to curve down toward a plateau at zero at 1.0 on the X scale. In ancient of days, how such things got done was with the aid of tracing paper and a French curve. So I authored a pair of software tools to stand in for those.
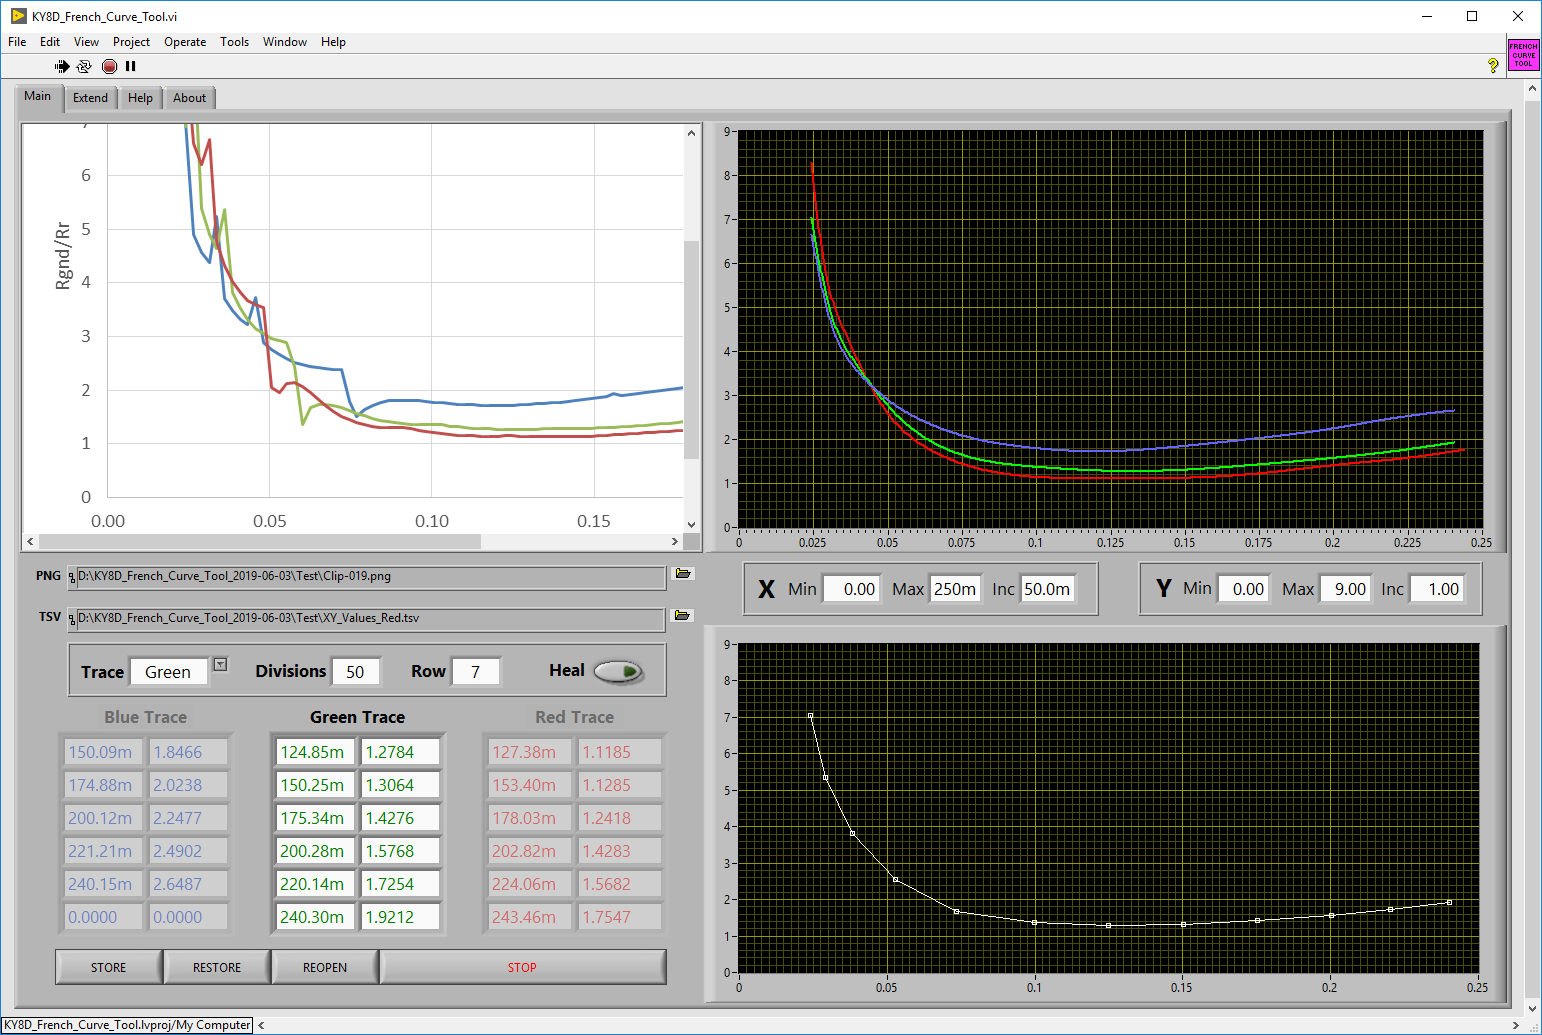
And below is a screenshot of my program authored in LabVIEW. As always, the project ballooned up in scale beyond my first, humble intensions. Something good enough to share. More than adequate for extracting data from any sort of graph whatsoever.
|
|
Standing in for tracing paper is my program Graph to TSV.exe, its source code written in Perl. You hover the mouse here and there over the graph, meanwhile tapping one or another of three arrow keys on the keyboard. Two key clicks will inform about the graphs scale in pixels, with very good accuracy to be had provided you've blown the image up big so that it contains lots of pixels. A bit of typing tells Perl the scale in real numbers.
Then for each curve, you hover and click perhaps as many as one dozen points. A dozen, that is, if it's curvy. Just two will do for anything linear. The X/Y locations for those ten or twelve curve points, together with two for the scale are all that you need. Click on save to store all in a tab-delimited, pure ASCII file.
Standing in for a French cuve, is my second program French Curve Tool.exe, its source code authored in LabVIEW. It will read in the tab-delimited ASCII, be informed of the scale, and also a number of curve points. These last it will treat as the X/Y location for knots on a spline curve.
The the software's bottom graph you will see the knotted spline. In its top graph you will see that same spline interpolated by as many points as you like. Choose 100 for the divisions, and the top graph will show itself very smooth.
It might also show one or more completely extraneous swoops. Those occur when any three consecutive spline knots form an angle too acute while also being too close to one another. Kind of like trying to bend a spring. So then what you do is edit their X/Y positions just slightly.
The way to do this is by scrolling said knot's X/Y locations to the top of its array window. There you can click beside any digit and use the Up/Down arrow key to give it a nudge. In column one to move the knot left/right, in column two for up/down. Best to start out with the second or third least significant digit.
Tiny nudges are generally all it takes to relax the virtual spring, calming and loosening any swoop back into a reasonable curve. You do it while comparing always agaisnt the orignal graph whose image you view in a sub-window at top left. With both of the right hand graphs so arranged as to display their major divisions for X and Y the same as seen on the original graph, it's not at all hard to make the top two to match one another exactly.
If still they will not, the first thing most likely to help is deleting a knot. Or possibly adding a knot. Do either by right-clicking on that knot's respective row in the array. Adding a knot will put it at 0/0 for X/Y. Click on Heal to repair that. A very exacting super-position can always be managed somehow. It just takes patience.
Once your curves are exact to the original, then if it's desired, a mouse click is all it will take to extend the curves by adding a spline knot in either direction. A new knot will append itself to the spline at either end, extending it one segment further. Its slope and magnitude will duplicate the segment before it.
You’ll need two things for it to run: my *.exe applications themselves, plus also the interpreter program on which it runs. Kind of like Java that way, except that the Java interpreter is probably pre-installed on your system. The LabVIEW run-time engine will not be.
ky8d.net/free where I give download instructions. ZIP archive software (like 7-Zip ) for extracting the *.exe file to somplace useful prior to trying to run it. Otherwise, Windows will issue dire warnings of an unrecognized app. Once extracted from out of its ZIP archive, however, Windows will know to pass it off to the LabVIEW Run-Time Engine instead.Until I get a how-to video uploaded, right-click on any GUI widget to get a description of what it is for.
Working on this, but not ready yet. My voice is presently not very presentable due to persistant coughing.